
We’ve heard it said a lot recently that the US economy has peaked and, although the world isn’t without challenges, much of this argument hangs on the simple view that it’s had such a good run of late, what goes up must come down.
The Mean Reversionists, as we call them, generally assume that the longer the period of unbroken growth, the more likely it is to break.
We’ve looked at the numbers and, even if the Mean Reversionists are correct, the current US growth spurt really isn’t that remarkable in terms of either length or magnitude.
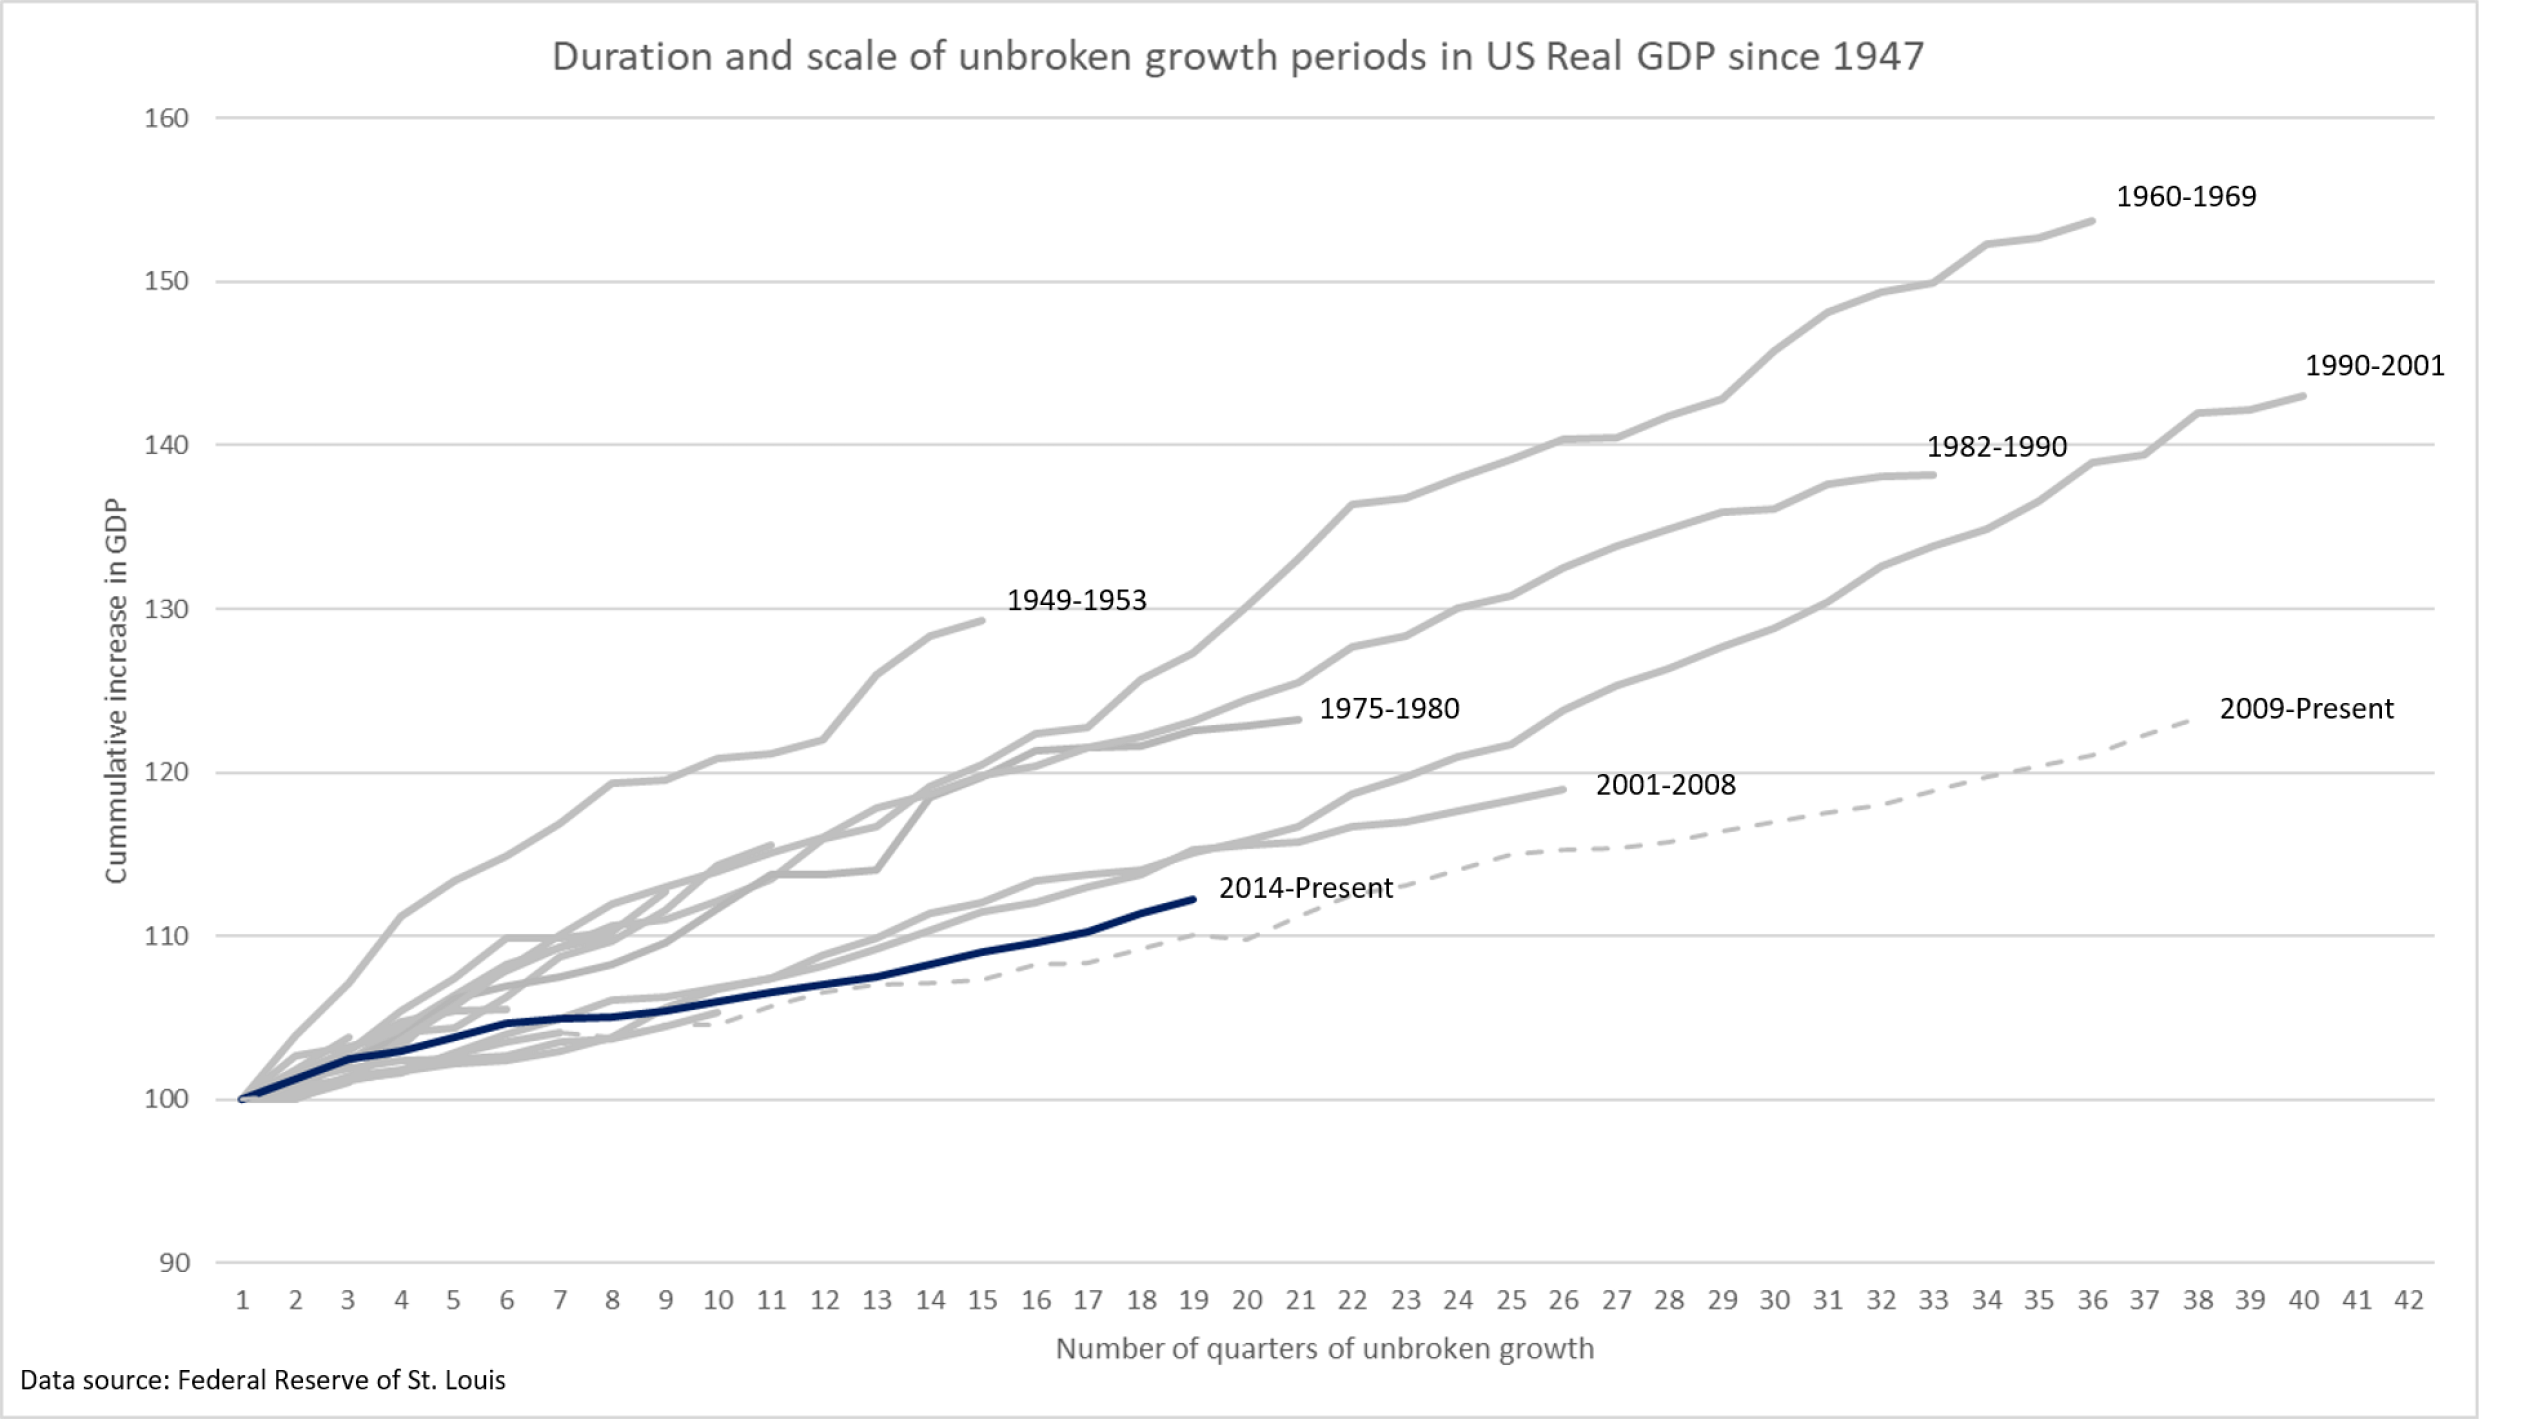
This chart shows US real GDP since 1947, with the duration of growth spurts (in quarters) on the horizontal axis and the increase in GDP (rebased to 100) on the vertical.
Given the economy stalled briefly at the start of 2014, the current period of unbroken growth (the blue line) is neither mature nor profound by historic standards.
To be fair the decline in 2014, as in 2011, was extremely small so being less purist with the data we also show the period from the end of the Global Financial Crisis to now (the dashed line). Although this growth spurt has a few grey hairs, it’s been very anemic by historic standards in terms of cummulative growth.
We’ll address some of the broader challenges in later blogs but for the Mean Reversionists, at least, the data doesn’t back up their argument.
Equitile Investments Ltd,
20 St Dunstan’s Hill
London, EC3R 8HL
Contact us on +44 (0) 203 397 7701
or email us at info@equitile.com


Copyright 2025 © Equitile, all rights reserved. Company number: 09459099.