
Warren Buffett had juices flowing in the UK earlier this month when he announced that, despite Brexit, he was still looking to make acquisitions here. His comments were immediately seized upon as evidence that leaving the EU won’t impact Britain’s standing as a key investment destination. Moreover, it was the strongest endorsement yet, given Buffett’s reputation as a value investor, of the idea that UK companies have been left extremely undervalued in the wake of the 2016 referendum. Once Brexit is sorted, the logic goes, international investors will come flooding back to UK equities.
We are not valuation obsessives at Equitile – in practice value investing has been a tale of woe in the UK for a number of years – but we thought it worthwhile taking a close look to see if there are bargains to be had. Especially as the UK stock market has lagged the US significantly since the June 2016 Brexit vote – the S&P 500 is up 39% whereas the FTSE 350 is up just 18%.
Surprisingly, despite the 20% underperformance, general market valuations suggest only a marginal discount of UK equities relative to the US; the trailing Price Earnings Ratio for the FTSE 350 is slightly below 18 times earnings while the S&P 500 trades at 18.5 times earnings, down from approximately 24 times earnings one year ago.
Averages, as ever, only tell us so much and the distribution of value across each of these two markets paints a more meaningful picture.
The chart below shows the percentage of S&P500 and FTSE350 companies in each range of Price-Earnings multiple.
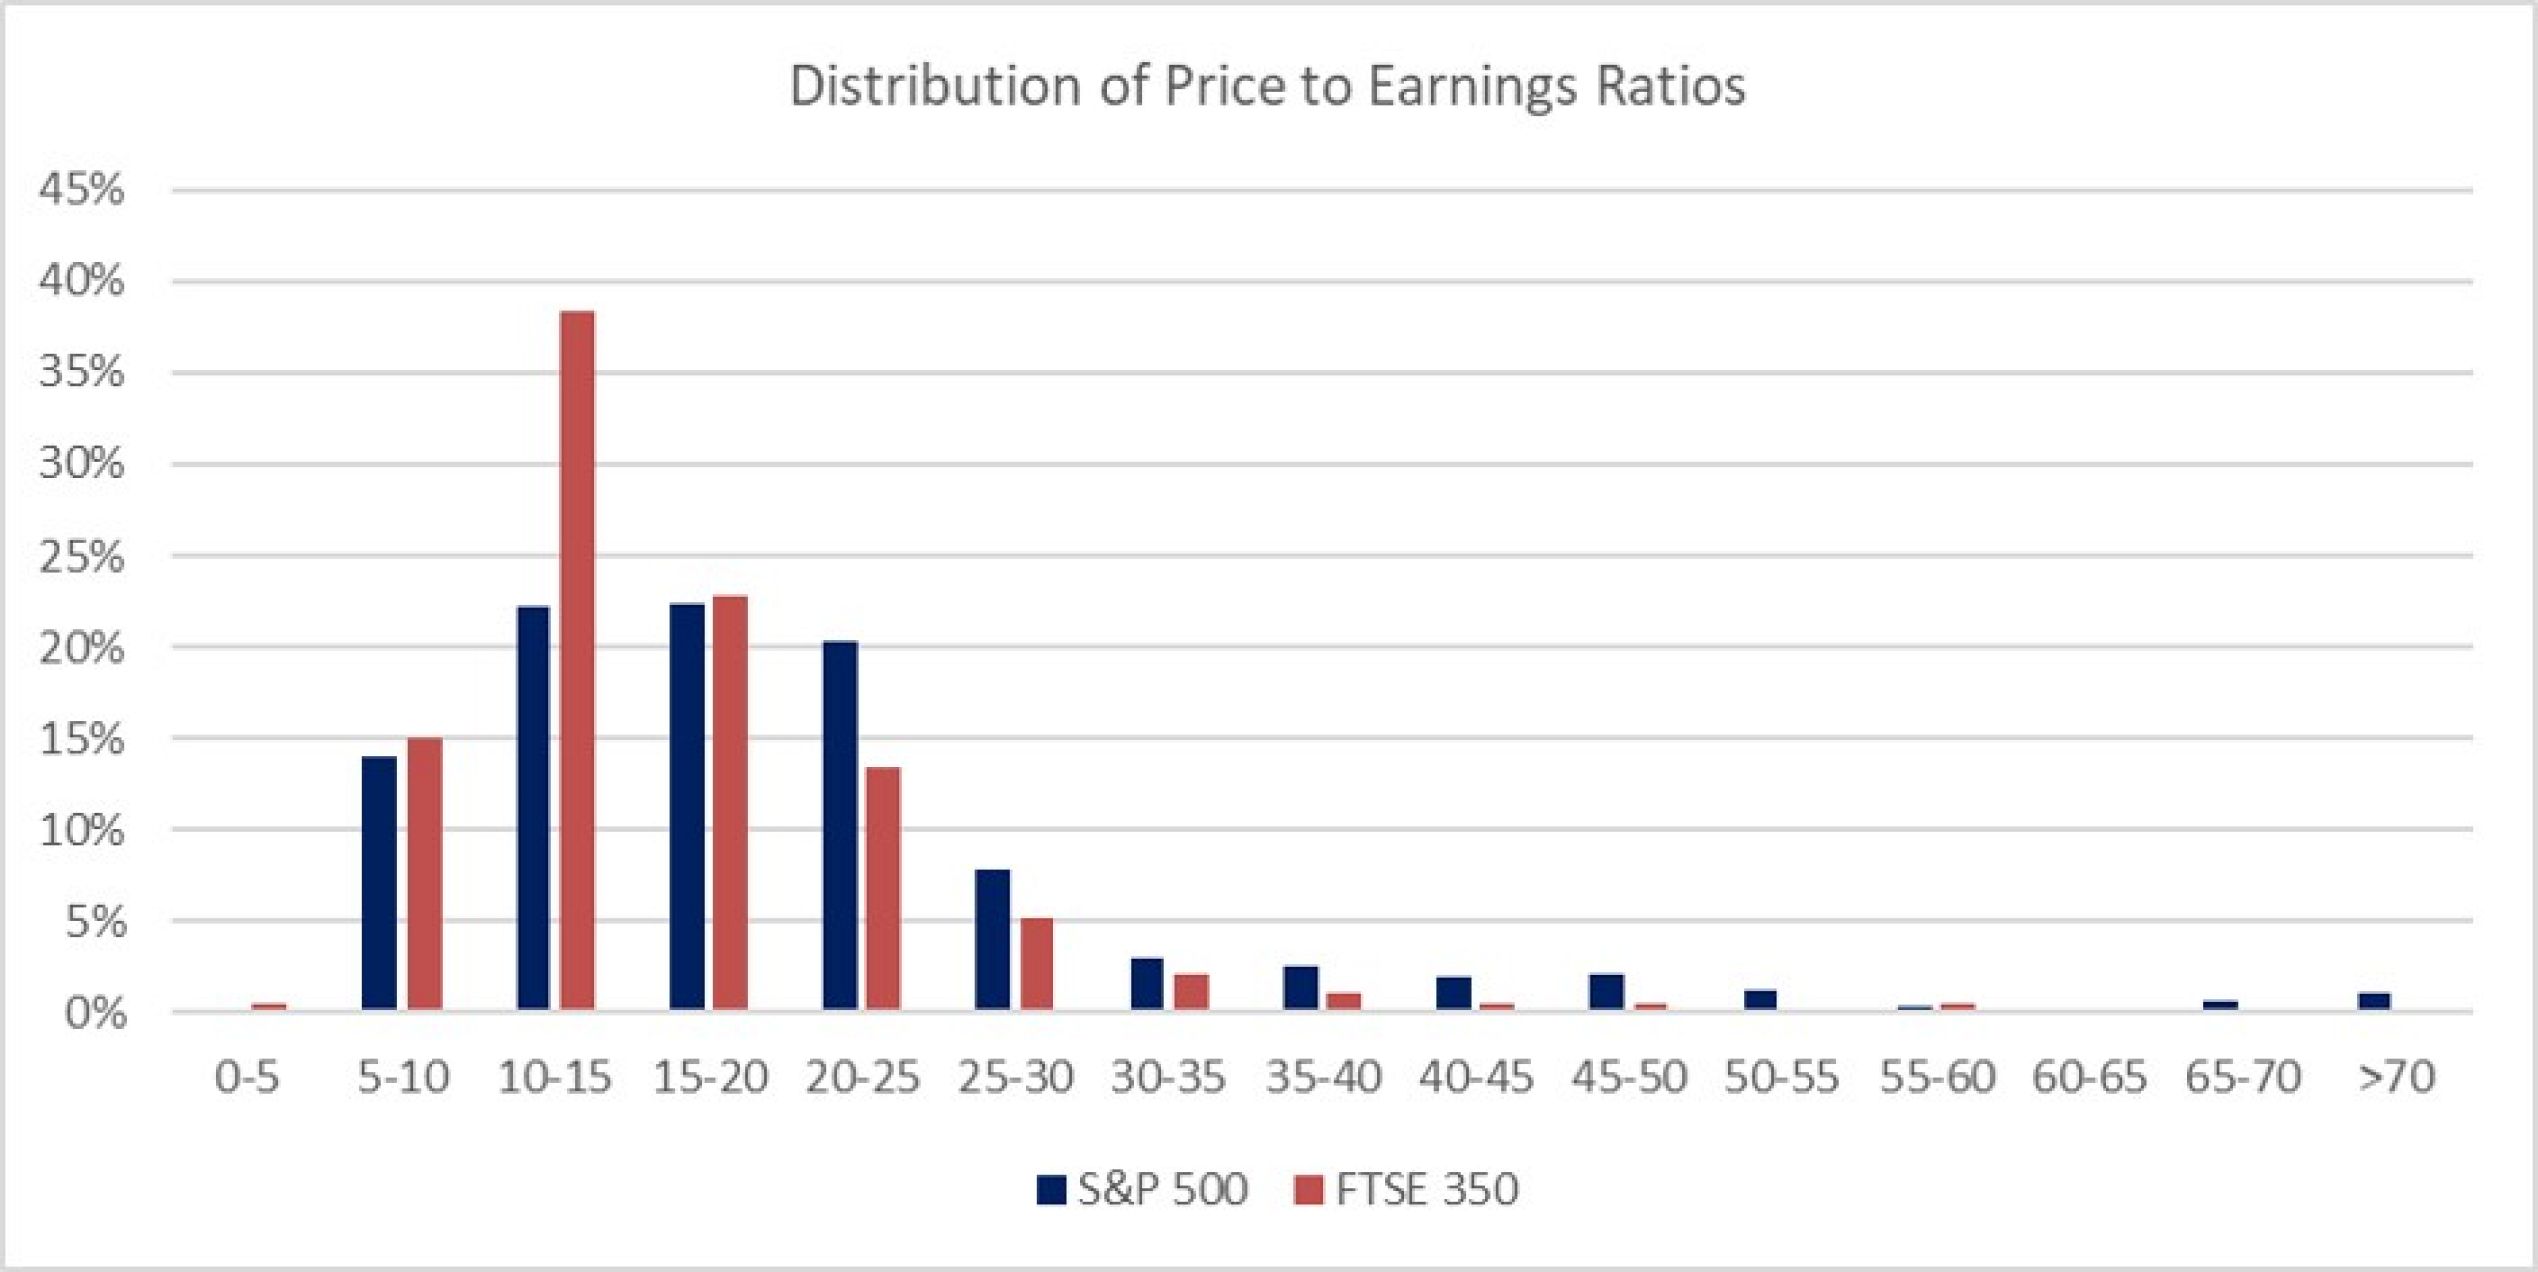
Although the distributions are not identical, a statistician would be hard pressed to prove the two distributions were statistically different. To our eyes it looks like the valuations of both the US and UK companies could have been sampled from the same population.
That said it does appear, superficially at least, that the UK index has a higher percentage of companies with a Price-Earnings multiple between 10-15X, which could reasonably be categorized as ‘value’ companies. The S&P500, nevertheless, still has more than 20% of its constituents i.e. more than 100 companies, within this ‘value’ range so there’s no shortage of options to buy relatively cheap, low PER, companies in the US.
When adjusted for growth at the company level, the distribution tells a very different story. The second chart shows the distribution of Price-Earnings-to-Growth (PEG) ratios for the constituents of the two indices. Although the UK has a slightly higher percentage of companies with a PEG ratio of less than one, in the still modest 1-2X range the US offers a much higher percentage of opportunities.
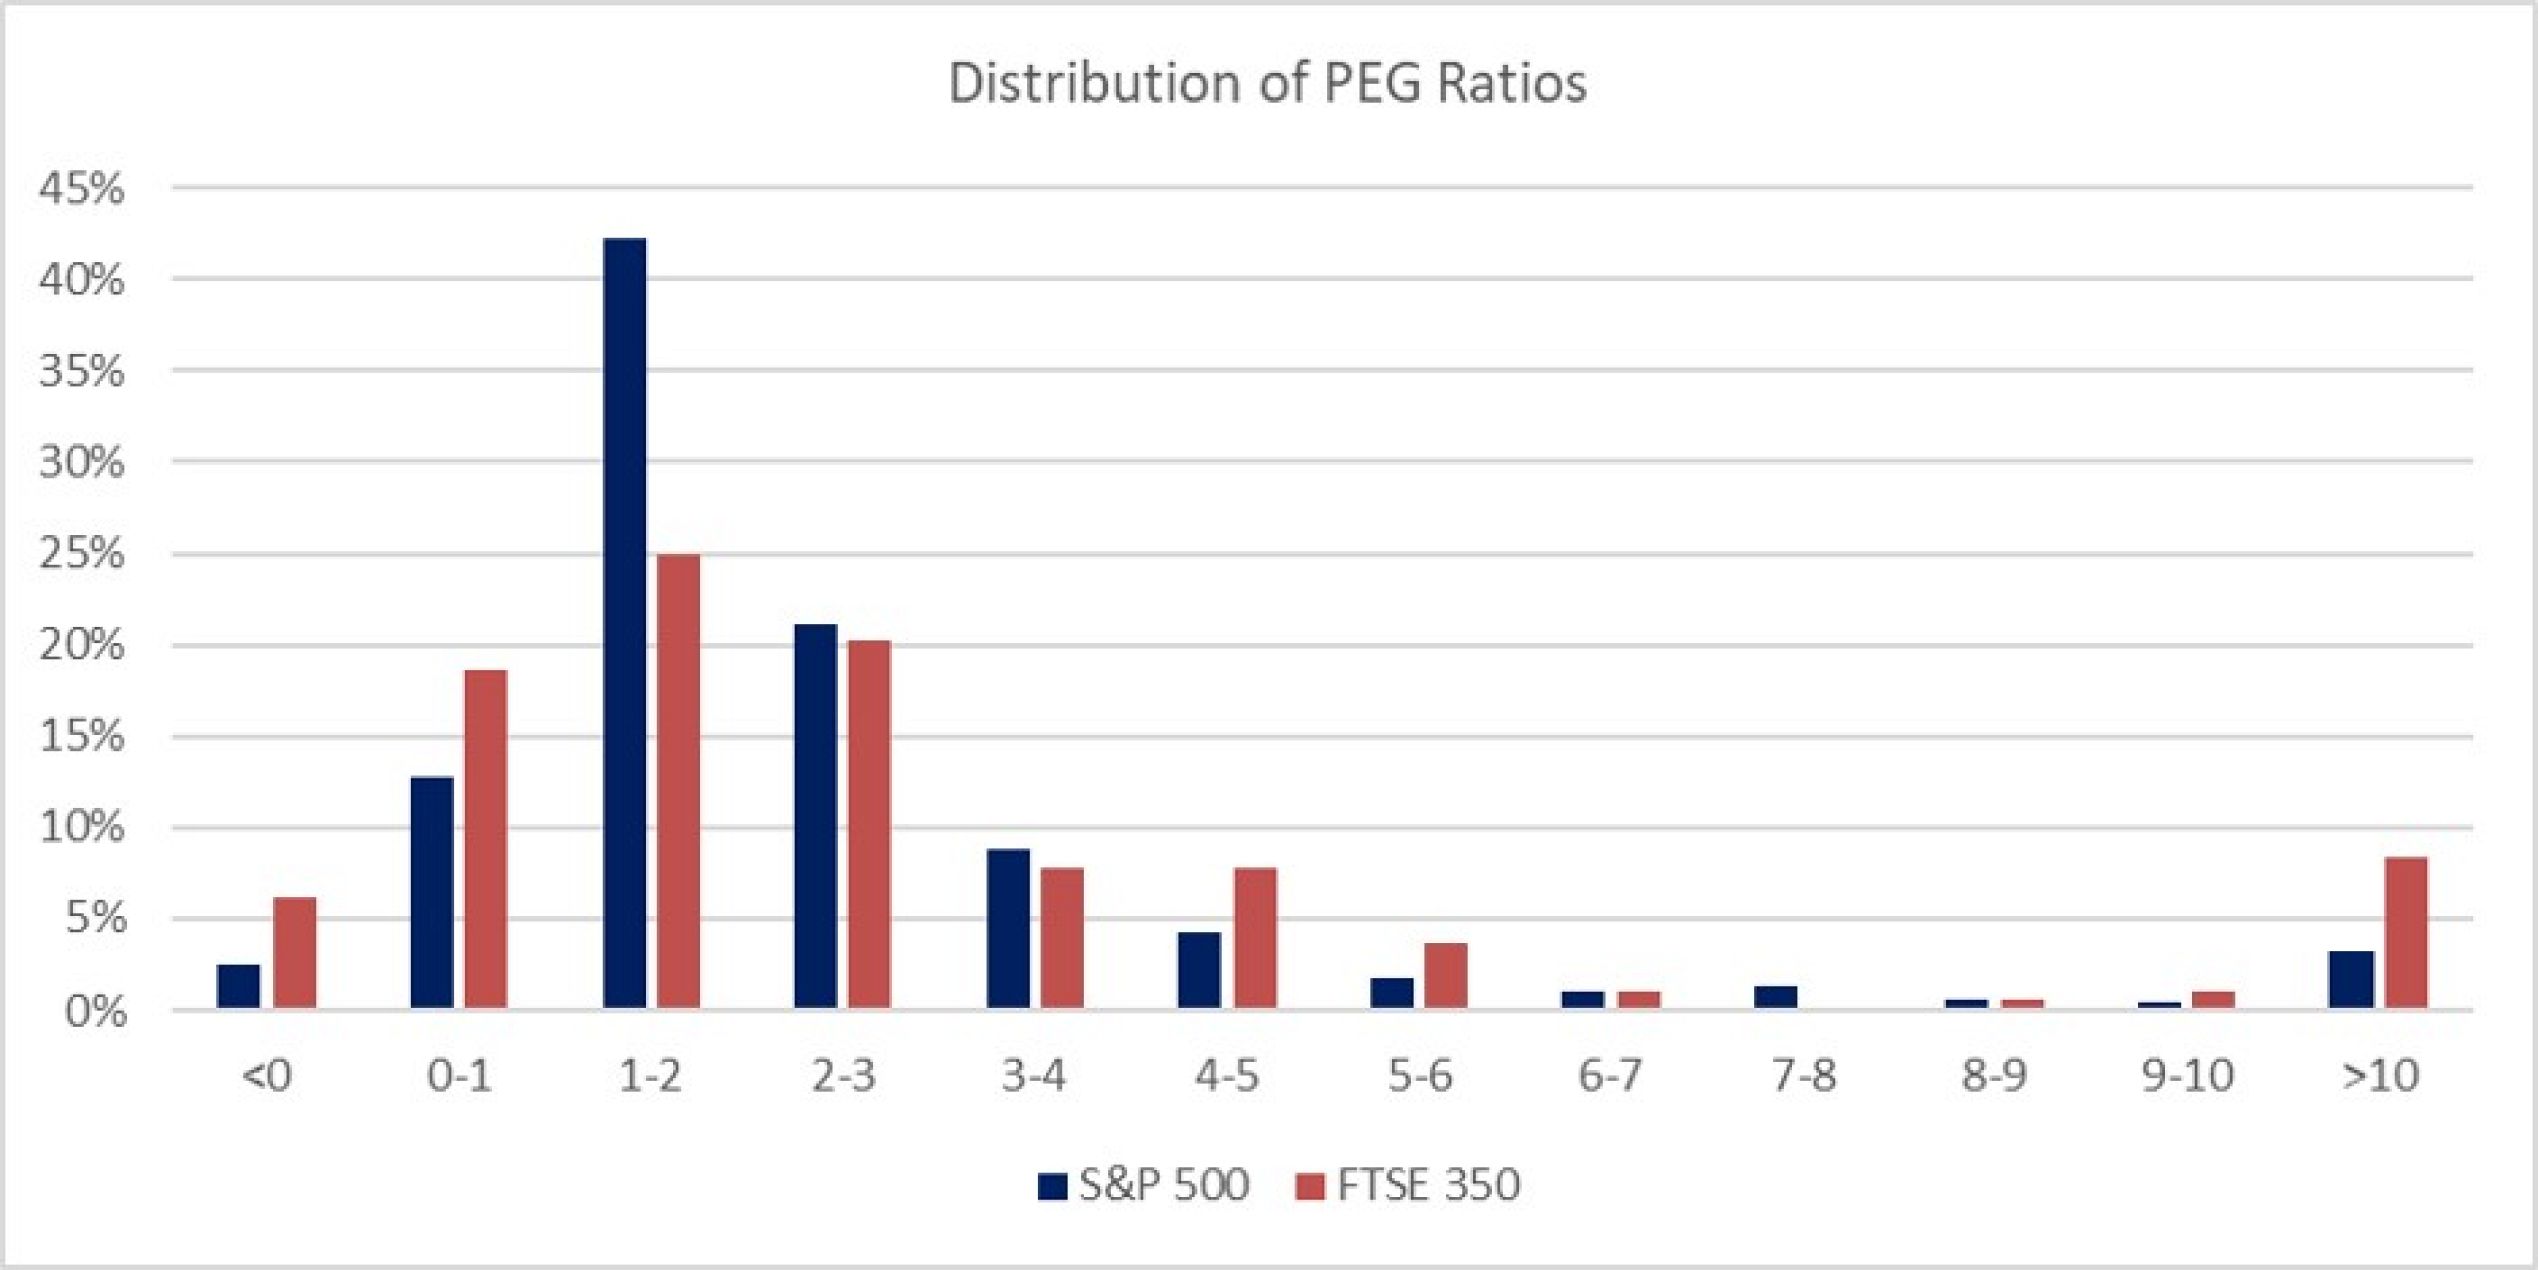
Despite much talk of UK PLC being up for sale it doesn’t seem, adjusted for growth, that the UK stock market offers more value than the US. In fact, despite its higher recent returns, the US still offers more value at this stage.
The so-called home bias is a well know phenomenon that continues to distort the way investors approach the stock market. People tend to invest in what they know and so, if you’re sitting in the UK, it’s natural to spend too much time thinking about the opportunity that UK equities present. A report from Charles Schwab last year found UK investors are especially prone to the home bias with three out of four of them looking to invest most of their assets in the UK. Brexit, if anything, has accentuated this tendency by focusing attention on a region which in fact represents just 6% of the global stock market.
The US continues to provide the most dynamic and positive backdrop for investing. US economic growth maintains a long-term trajectory well above that in the UK – the most recent quarter showed annual growth of 3.2% versus 1.8% in the UK. Moreover, when adjusted for earnings growth, the US market offers more than enough value opportunities relative to the UK – despite Brexit.
Equitile Investments Ltd,
20 St Dunstan’s Hill
London, EC3R 8HL
Contact us on +44 (0) 203 397 7701
or email us at info@equitile.com


Copyright 2025 © Equitile, all rights reserved. Company number: 09459099.