
The spectre of inflation has spooked stock markets since the end of last year with headline rates in the US for example above 7% – the highest since 1982. The Bank of England this week suggested that the UK will see a similar rate by April.
There are clear reasons why this inflationary impulse has occurred. Central banks around the world have supported a significant increase in deficit spending through the purchase of government debt and so we have witnessed the biggest Keynesian stimulus since World War Two. The Federal Reserve has more than doubled the size of its balance sheet since the outbreak of COVID-19. Moreover, this massive monetary expansion has been accompanied, for the first time in history, by government policies to shut down large sectors of the economy and impose working practices that have made it impossible for businesses to function as normal.
The outcome has been supply-chain disruption such as we have never seen which, as economies have opened, has led to both price and wage pressure throughout the system. Commodity and basic materials have seen prices up 20-80% from their lows and wages in some sectors, especially hospitality, have been rising at more than 10% p.a.
There are signs that some of this pressure may be about to ease. Industrial production is stabilizing back to pre-pandemic levels, shipping rates are now collapsing, and basic material prices are rolling over (except oil and gas). There are also signs that wage pressure isn’t compounding quite as much as feared as labour participation rates pick up.
We wouldn’t want to get too confident on the inflation front but if it is close to a peak, what would this mean for investors?
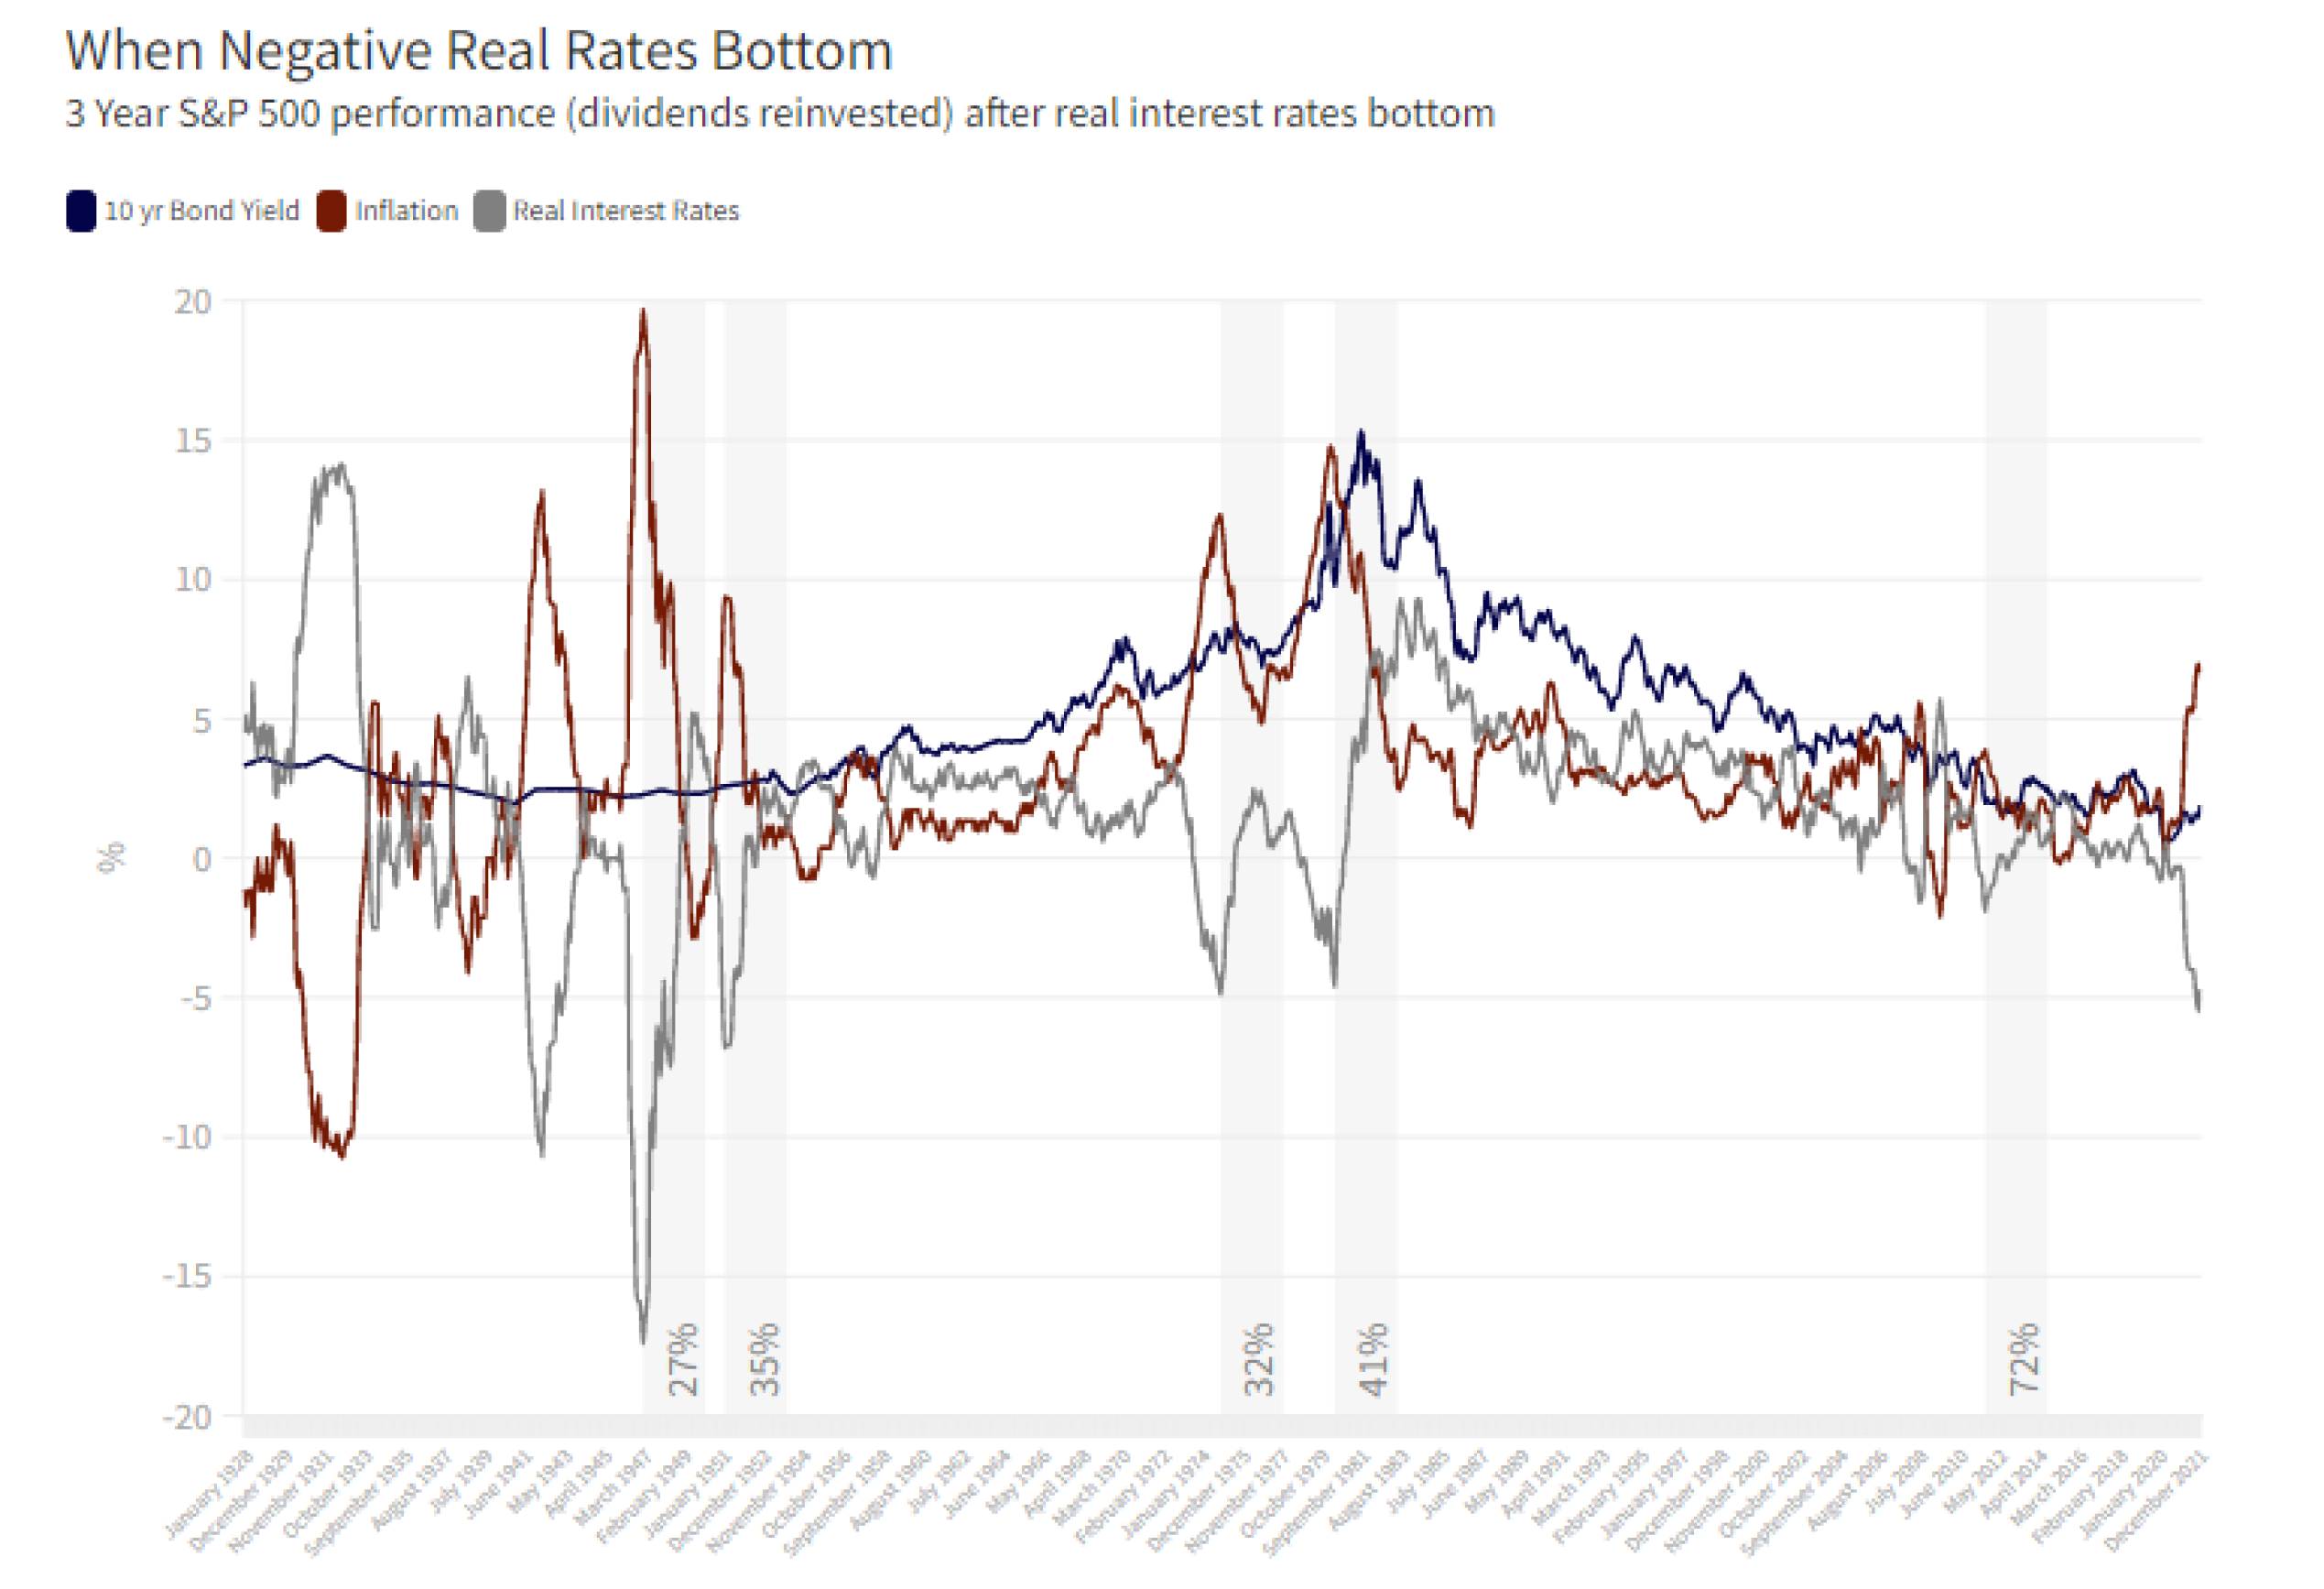
Although several interest rate hikes from the Federal Reserve are now priced in and bond yields have moved up this year, we still face the most negative real (inflation adjusted) yields since the 1970s.
Looking through a long lens in this chart going back to 1928, when negative yields have reversed it’s been because inflation has fallen sharply, not because bond yields have risen.
Once that reversal happens and real negative yields bottom out, it’s generally been a good time to buy the stock market with a long-term view. The grey bars on the chart show the ensuing 3 years market performance from the month that real rates turn.
Equitile Investments Ltd,
20 St Dunstan’s Hill
London, EC3R 8HL
Contact us on +44 (0) 203 397 7701
or email us at info@equitile.com


Copyright 2025 © Equitile, all rights reserved. Company number: 09459099.